
01
Sales rise. The bottom line barely moves.
More customers and more work should create more return. Where is it being absorbed?
Analytics cookies
We use Google Analytics to understand which pages are useful and how visitors find us. We only load it if you accept.
Belscar Growth & Margin Review
Your team is working harder and revenue is moving, but the return is disappointing. We trace where value is being lost across sales, delivery, margin and costs. Then we show you the first change worth making.
For owners and leadership teams of established businesses in the UK, UAE and beyond.
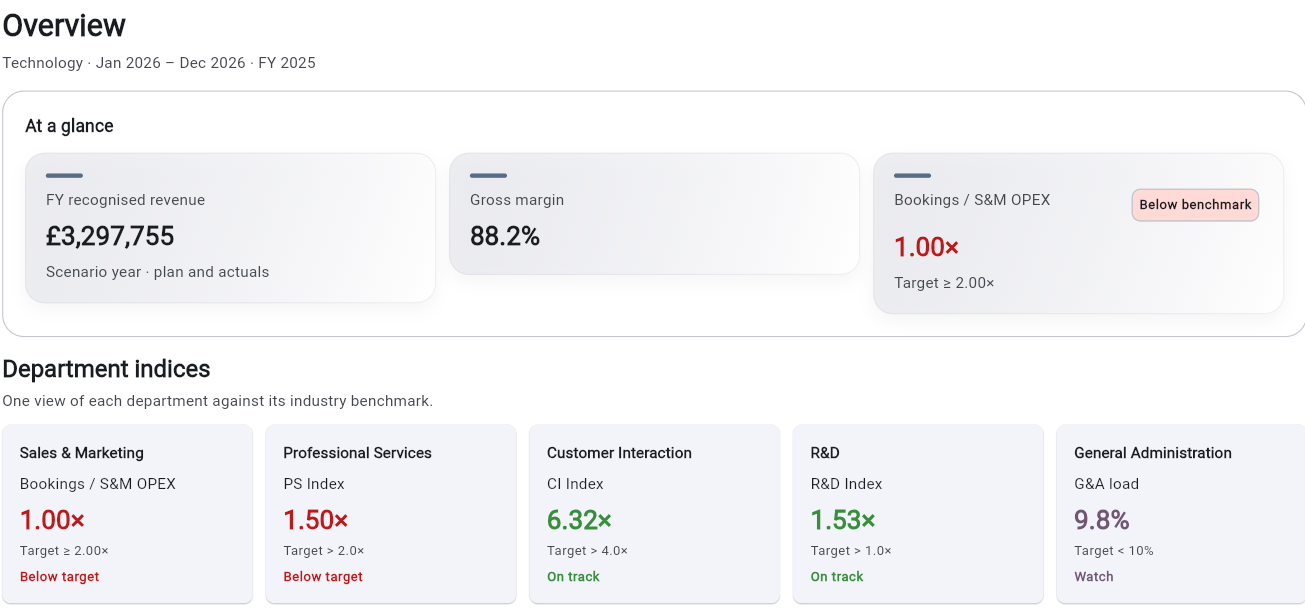
Illustrative technology company data in GBP. Figures are examples, not client results.
Does this sound familiar?
01
More customers and more work should create more return. Where is it being absorbed?
02
Sales points to delivery. Delivery points to pricing. Finance points to costs. You need one joined-up answer.
03
Before you approve another hire or campaign, see whether it fixes the real bottleneck.
What you leave with
The main issue holding performance back, the evidence behind it and the gaps to check.
The first changes to make, who owns them, and what to measure over the next 90 days.
A short set of measures to review regularly, so you can see whether the changes are helping.
Tell us where the numbers stop making sense. We'll use the first call to understand the issue and whether this review is the right starting point.
Book a 20-minute callHow the review works
We follow the money from demand to delivery, then test the explanations against how your business really works. You get a decision you can defend and a plan you can use.
01
We review your revenue streams, direct costs, commercial spend, pipeline and current operating rhythm. We also flag gaps in the data that could distort a decision.
02
We connect the numbers to how the business works, then identify the issue most likely to be limiting progress. You see the evidence and the assumptions behind the conclusion.
03
We test practical options, agree the priority actions and set a 7 / 30 / 90-day plan with measures to review. The aim is a decision your team can act on.
Keep it. We use CPI to turn your financial picture into a plan for improving performance: see which departments need attention, test the changes worth making and agree what to do over the next 90 days.
The question behind the numbers
More leads will not solve expensive delivery. Cutting costs can weaken a sales team that is already stretched. We use CPI to connect sales productivity, margin and overhead, then work through the evidence with you to identify the main constraint.
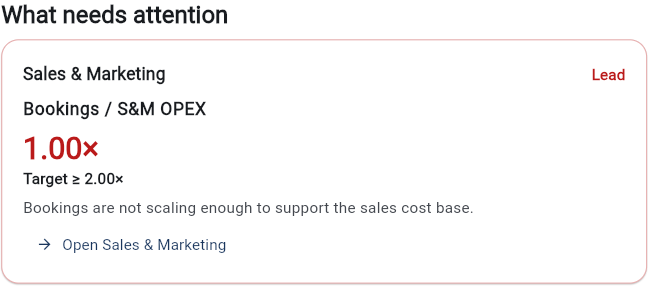
In this demo, the application flags bookings relative to sales and marketing spend. It is an example of the evidence we would investigate, not a diagnosis of your business.
Test the options
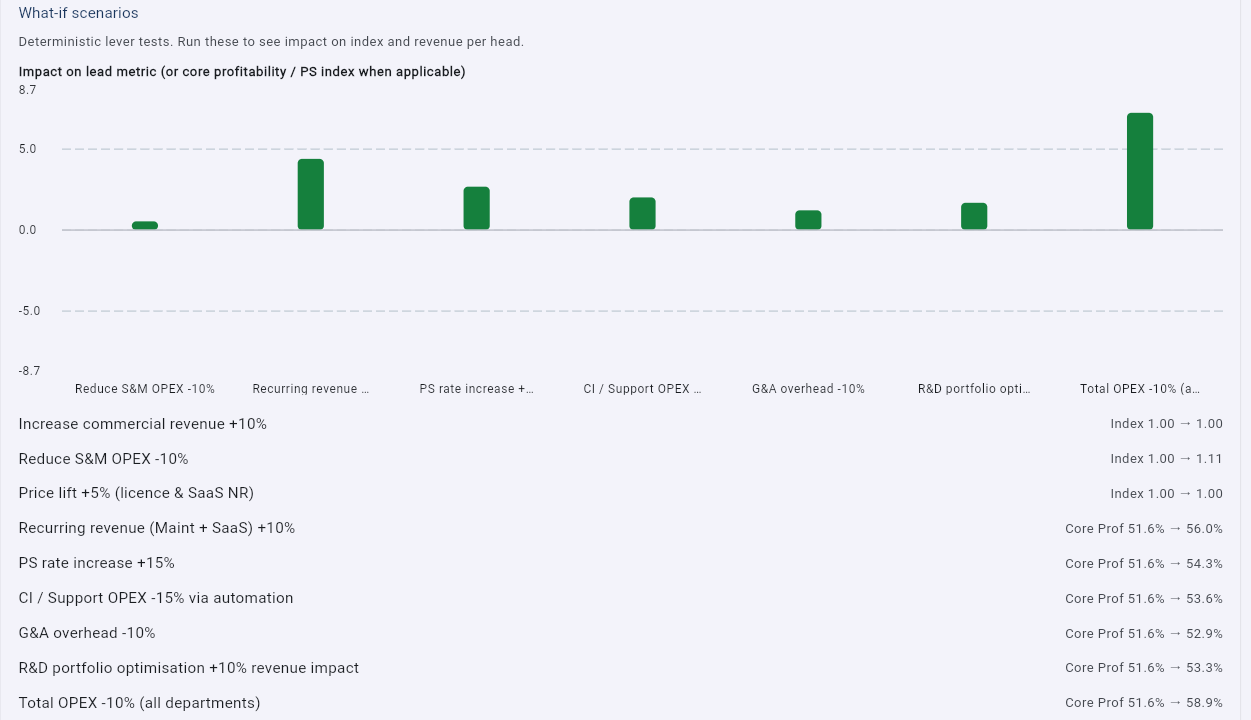
Would a price change do more than another hire? Is the mix of work dragging down margin? We model practical options against your current position so you can compare the potential effect before committing budget.
The framework behind the work
Your Company OS gives you control of the work and a live view of what is happening. Our Growth & Margin Review uses the Commercial Performance Index (CPI) to step back from the daily activity, explain what is driving growth and profit, and help you decide what to improve first.
We work through the numbers with you and agree the next steps. After the review, we can discuss ongoing CPI access and help putting the plan into practice.
Struggling to get a reliable view of orders, stock or the daily work? See how Company OS brings it together →
Want to work through the problem first? Read why revenue can grow while profit falls →
Common questions